We have a guest contribution today from Brian Cronquist, MonolithIC 3D Inc.'s VP of Technology & IP. Brian discusses how value of a company's patent portfolio can be quantified.
and all through the Valley,
engineering mangers are up and about,
counting what IP they have for some clout.
Being the end of the year, people like to sum up the previous x number of months or year. IEEE is no exception. The IEEE Spectrum just published their Patent Power Scorecard Update, where they compile and calculate the innovation scores of companies worldwide, in this case for 2010.
Guess who was #1 for Electronics in 2010???
It has to do with their PowerScore.
In 2006, IEEE hired a company called 1790 Analytics (year 1st US patent was granted) to value the quality, not just the quantity, of a company’s patents. We have all seen some pretty worthless patents in our day, right? So, not all patents are created equal….
To derive a company's PIPELINE POWER score, 1790 Analytics first counted the number of U.S. patents the company obtained last year. Only companies that were awarded 25 or more patents in 2010 made the cut. The research firm then multiplied the company's patent count by the product of four variables that it calls Pipeline Growth, Pipeline Impact, Pipeline Generality, and Pipeline Originality.
Growth simply measures the rate at which a company obtains patents over time. But to assess the relative impact of patents on other patents based on citations, 1790 Analytics created a scoring scale for Impact, Generality, and Originality. To do so, they determined the average score for an indicator for all patents from the same year and technology class and assigned that average a value of 1.0. Indicator scores above 1.0 show organizations whose patents perform better than expected on a given metric. Values below 1.0 show organizations whose patents perform worse than expected. For example, Apple's Pipeline Impact of 1.91 shows that its patents are cited 91 percent more frequently than expected.
PIPELINE GROWTH shows the trend in an organization's patent activity by dividing the number of patents obtained in 2010 by the annual average for the years 2005 through 2009.
PIPELINE IMPACT shows how frequently patents issued in 2010 cite a company's patents issued from 2005 through 2009. This metric is based on citations both from the organization itself and from other organizations. It reflects both the extent to which a company is developing its own technology and the impact of its technology on others in the industry.
PIPELINE GENERALITY measures the variety of technologies that build upon an organization's patents. This metric is based on the notion that patents cited by later patents from many different fields tend to have more general application than patents cited only by later patents from the same field.
PIPELINE ORIGINALITY measures the variety of technologies upon which an organization's patents build, based on the concept that inventions created by combining ideas from several different technologies tend to be more original than those that make incremental improvements upon the same technology.
Take a spin thru the entire table. There are categories of Aerospace & Defense (Honeywell #1), Automotive & Parts (Toyota #1), Biotechnology & Pharmaceuticals (Johnson& Johnson #1), Chemicals (DuPont #1), Computer Peripherals & Storage (Netapp #1), Computer Software (Microsoft #1), Computer Systems (IBM #1), Conglomerates (Toshiba #1), Electronics (Apple #1), Government Agencies (US Navy #1), Medical Equipment/Instruments (Medtronic #1), Scientific Instruments (Fisher Scientific #1), Semiconductor Equipment Manufacturing (AMAT #1), Semiconductor Manufacturing (Samsung #1), Communication/Internet Equipment (Cisco #1), Communication/Internet Services (Yahoo #1), Universities (U of California #1). As far as an overall across all categories power ranking, Apple came in 12th out of the top 340 companies! Seems like taking a bite out of an apple can be innovative.
So how is little ol’ MonolithIC 3D Inc. doing? We just announced the 5th and we have over 50 in the pipeline. Not bad for 19 months…. Practical monolithic 3D-IC is truly innovative.
_________________________________________________________________________________________________
And now: O USPTO: Do you know the way to San Jose? …as the old Dionne Warwick song goes…..
The United States Patent and Trademark Office (USPTO) is interested in gathering information from the public on potential locations for future USPTO satellite offices and published Tuesday a Federal Register Notice announcing the comment period. The USPTO is required to establish satellite offices, subject to available resources, under Section 23 of the America Invents Act (AIA). In fact, as long as funding exists, it is the plan of the Patent Office to establish at least two more satellite offices in addition to the one slated for Detroit over the next three years.
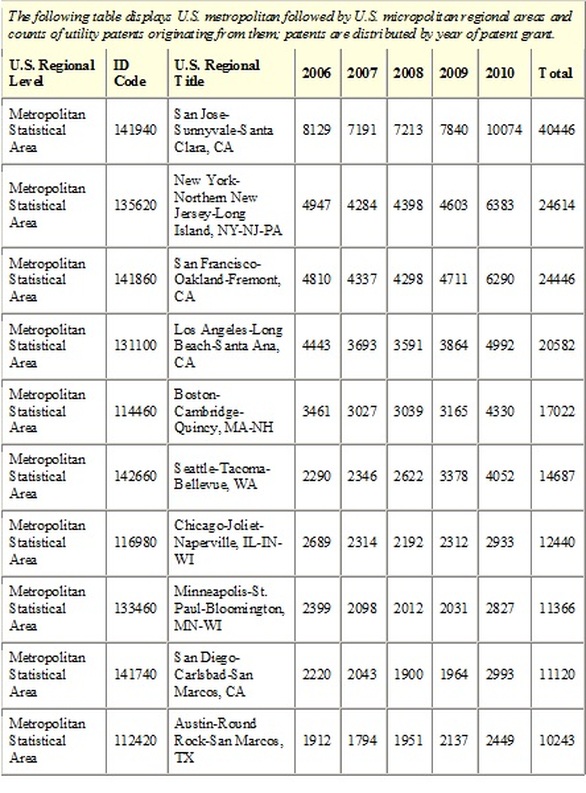
Here are the top ten metro areas
ranked by patents granted over the past 5 years.
It’s clear that the Bay Area should be #1 on the satellite office list.
http://www.uspto.gov/web/offices/ac/ido/oeip/taf/cls_cbsa/allcbsa_gd.htm
http://www.uspto.gov/web/offices/ac/ido/oeip/taf/reports_cbsa.htm
Ranked Listing of U.S. Metropolitan and Micropolitan Areas
From Which Utility Patents Originated During the Period
Having Primary Classification In
Class ALL, ALL CLASSES
( patent origin is determined by the residence of the first-named inventor )
( regional areas are based on U.S. Core Based Statistical Area (CBSA) )
( patent counts may not sum exactly due to rounding - see the Explanation of Data )
Written comments are requested to be submitted on or before January 30, 2012, and no public hearing will be held.
Those interested in submitting comments may do so by e-mail, sending comments to the USPTO at [email protected]. Written comments may also be submitted by snail mail addressed to: Azam Khan, Deputy Chief of Staff, United States Patent and Trademark Office, Mail Stop Office of Under Secretary and Director, P.O. Box 1450, Alexandria, VA, 22313–1450.


 RSS Feed